US Dollar Technical Analysis: Greenback Snaps Losing Streak
DailyFX.com -
To receive Ilya's analysis directly via email, please SIGN UP HERE
Talking Points:
US Dollar Technical Strategy: Holding Long via Mirror Trader Basket **
Support: 11754, 11719, 11692
Resistance:11809, 11864, 11899
The Dow Jones FXCM US Dollar Index snapped a six-day losing streak, forming a bullish Piercing Line candle pattern and hinting at a rebound ahead. A daily close above the 100% Fibonacci expansion at 11809 exposes the 76.4% level at 11864. Alternatively, a move below the 123.6% Fib at 11754 opens the door for a challenge of the 138.2% expansion at 11719.
We remain broadly bullish on the US Dollar against its leading counterparts in line with ourlong-term fundamental outlook. As such, we remain long via the Mirror Trader US Dollar currency basket.
Add these technical levels directly to your charts with our Support/Resistance Wizard app!
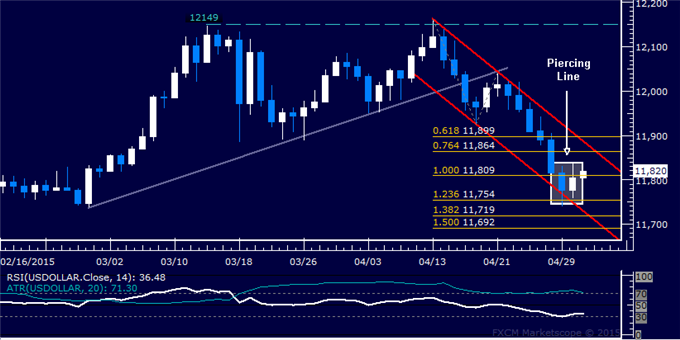
Daily Chart - Created Using FXCM Marketscope
** The Dow Jones FXCM US Dollar Index and the Mirror Trader USD basket are not the same product.
--- Written by Ilya Spivak, Currency Strategist for DailyFX.com
DailyFX provides forex news and technical analysis on the trends that influence the global currency markets.
Learn forex trading with a free practice account and trading charts from FXCM.